In an effort to better understand which factors correlate with high site performance, we analyzed 105 super-popular sites using our own analysis tools – mainly Squirrly SPY and ContentLook – and a few other tools available on the market right now.
We looked at keywords and content.
We looked at the sites’ domain score, backlinks, social media shares, and how fast they load on mobile and desktop.
We even looked at their SEO issues and errors.
Our analysis revealed some very interesting insights about the “DNA” of top-performing sites, the things they focus on, how they manage to stay ahead of their competition – and the things they could do to be even more successful.
With this article, we’re going to share with you what we found.
Here Is a Summary of Our Key Findings
1. Our data suggests that on average, the sites included in this study optimize a page/article for 4 keywords, and each of those keywords is composed of 2 to 4 words. Optimizing for multiple keywords (including long-tail keywords) appears to be a part of these sites’ SEO strategy.
📌By optimizing for a secondary keyword that is related to your primary keyword, you’re sending additional signals to search engines to help them understand and rank the page.
2. 102 out of the 105 popular sites analyzed have an SEO Score* of 40 or more, which indicates that they are investing time and resources into optimizing their content for SEO.
📌*SEO score is a metric calculated by our content analysis tool: ContentLook.
3. The average web page we analyzed in this study takes 4.43 seconds longer to load on mobile vs. desktop.
4. All sites included in this study have implemented the Open Graph Protocol.
📌 Open Graph lets you control what content is displayed when pages are shared on social media, thus influencing your page’s performance.
If you lack these tags, then you’re risking that an unrelated image or inaccurate description will be shown. On the flip side, having these tags helps you harness the power of social media and boost your social media CTR.
5. Our data shows that the majority of the successful sites we analyzed create long-form content, with the average number of Words for all sites being 1,481.
6. All sites in this study have Social “Follow me” Buttons, as well as Share buttons in their articles.
📌 Social signals are a confirmed ranking factor, so it’s important to make it as easy as possible for visitors to share your articles and follow you on social media.
7. We saw that there is a correlation between the length of a keyword and the position it ranked on Google. Namely, keywords that were formed of 3 words typically ranked on the 1st Page of Google.
8. The most common SEO issue we’ve identified across the sites that we analyzed was the issue related to Empty Descriptions.
📌 Google doesn’t want to place sites with coding problems up in the first positions. Sure, the search engine is smart enough to generate the description on its own, based on the content inside the URL, but it’s still a bad practice.
By fixing this issue, the sites included in this study could be even more successful.
9. We discovered that ALL sites included in this study have both Site Icons and Apple Icons.
📌 A Site Icon is an icon associated with a website to be displayed with bookmarks, in the URL bar, on tabs – and anywhere else where a website has to be identified visually.
📌 Apple Icons are the graphics you’ve chosen to represent your site when a user saves your page to their home screen in iOS. If you don’t have Apple Icons created for your site, iOS grabs a compressed thumbnail of your website and displays it as the icon. (the result is typically indistinguishable and not visually unappealing).
10. Twitter Cards can be found across all sites which we’ve analyzed for this study.
📌 Twitter Cards are a great partner to your SEO strategy, as it helps you stand out to Twitter users and thus increase engagement and CTR.
11. The average domain age is 13 years, which shows once again that success isn’t built overnight.
📌Domain age indicates how long it has been since Google first indexed that domain, or saw a link to the domain, and is a factor in determining Google rankings.
12. Getting backlinks from different sites correlates with being a top-performing site. The websites included in our study are attracting a significant number of backlinks.
13. A high domain score correlates with high-performance. The average Domain Score for all sites we analyzed in this study is 81.98.
14. A high On-Page SEO Score (as measured by Ubersuggest) correlates with high site performance. The average on-page SEO score for all sites included in this study is 85.48.
15. Data from our study suggests that one can compensate for having pages with low authority by working on optimizing their content. This is most evident for sites that are in the 40-49 SEO Score segment of our analysis.
16. All sites included in this study are listed as Safe Browsing sites.
📌 Google Safe Browsing displays warnings to users when they attempt to navigate to dangerous sites or download dangerous files. Safe Browsing also notifies webmasters when their websites are compromised by malicious actors.
No one wants to visit a site that puts their personal information at risk or tries to install malicious code on their computer. That’s why making sure your site is a Safe Browsing site is key.
Furthermore, Safe Browsing is set to become part of the page experience ranking update going live in 2021.
17. Despite being extremely popular sites with large marketing budgets, our study revealed that they are still making common SEO mistakes that prevent them from maximizing their success on Google.
Every site we analyzed had at least one SEO error. The majority of sites we looked at had over 8 issues each.
These are the top 3 most common issues we’ve identified across the 105 sites:
1. URL is Poorly formatted for SEO (89.5% of sites have this problem)
2. The < title > tag is too long (84.8% of sites have this problem)
3. The < title > tag is too short (84.8% of sites have this problem)
18. Most sites included in this study have no-follow outgoing links.
📌 Using the nofollow tag is a way in which publishers can tell search engines NOT to count some of their links to other pages as “votes” in favor of that content. Based on the results of this study, we can say this is a best practice among successful, top-performing websites.
19. Google considers the site’s speed a ranking factor. We saw that even the big sites are struggling with getting this perfect, though. The average speed of sites included in this study is 4.19 seconds (on desktop). On mobile, it’s 8.62 seconds.
📌 This is longer than what is broadly viewed as a good loading speed. Ideally, it should take your pages 3 seconds or less to fully load (both on desktop and on mobile).
20. Our analysis of 105 sites revealed that top sites have lots of Facebook and Pinterest Shares. There is also a high correlation between social signals and ranking position.
Study SET-UP
- How many sites did we analyze?
We analyzed 105 popular sites for this study.
- How did we choose which sites made it into our study?
The sites that we analyzed were chosen based on who our users are following on Twitter. We also included sites that are typically mentioned in articles published across top SEO and marketing sites.
All sites we analyzed are e popular, top-performing sites that have significant marketing budgets. They are all sites that people perceive as being successful and whose performance is well above the average.
- How did we collect the data for this study?
We mainly used ContentLook, Squirrly SPY, as well as one other audit tool that is not created by us.
- What were the aspects that we focused on in this study?
We looked at Overview Data for each site, namely:
- Organic keywords (as measured by Ubersuggest; shows the number of keywords each domain ranks for in the organic search)
- Organic monthly traffic (as measured by Ubersuggest; the total estimated traffic each domain gets, considering the organic keywords)
- Domain score (as measured by Ubersuggest; based on a variety of factors, this indicates the overall strength of a website. A score from 0-100 was given to each site; the higher the number, the more authoritative a site is and the higher it ranks on Google)
- Backlinks. We checked to see how many incoming hyperlinks from other websites to each domain.
- On-Page SEO score (as defined and measured by Ubersugegst). The On-Page SEO Score is a 0-100 SEO Score, with 0 being the lowest possible score. The score represents a combination of the ratio of issues found to the number of checks performed by the audit tools in Ubersuggest. It’s an overall score for all pages scanned in the audit.
We also looked at the sites’ speed (both for desktop and mobile), whether they have social media elements present on their sites, and analyzed the SEO errors for each site.
In addition to that, we analyzed the top pages for each site and the estimated amount of organic traffic those pages receive every month.
We were also interested in learning how many keywords they are ranking for (and on which positions); how many words are on their top-ranking pages – and other similar details that would allow us to learn more about which are the factors that contribute to their success.
How Did We Organize the Collected data?
To keep everything organized, we decided to group the data into multiple categories, namely:
- overview data for the whole site;
- site speed data;
- data related to the top pages of each site;
- keywords-related data;
- data related to SEO errors.
Overview Data Conclusions for all 105 Sites
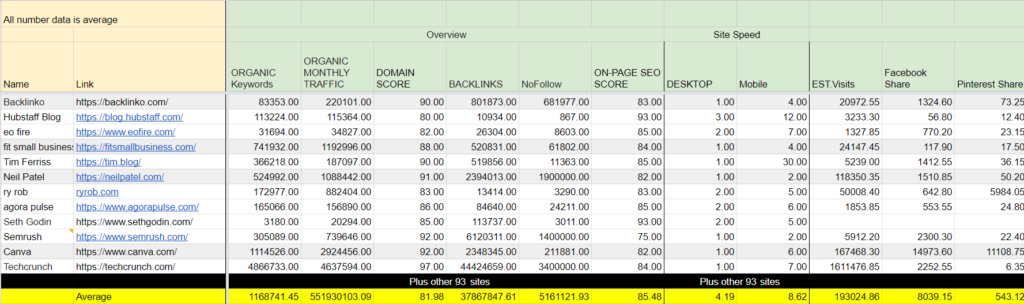
Here’s everything we studied at a site level:
- the number of organic keywords sites rank for on Google;
- the amount of monthly traffic;
- the Domain Score;
- the number of backlinks;
- the on-page SEO Score.
After obtaining the data for each site, we did an average of all the sites.

These are the Results:
The average number of ORGANIC Keywords for all sites is 1,168,741.45.
The average number of ORGANIC MONTHLY TRAFFIC for all sites is 551, 930,103.09.
The average number of DOMAIN SCORE for all sites is 81.98.
💡What is the Domain Score?
Influenced by a variety of factors, the Domain Score is an indicator of the overall strength of a website. A score of 1 to 100 is given to all sites, and the higher the number, the more authoritative the site is (which also translates to higher Google Rankings)
The average number of BACKLINKS for all sites is 37,867,847.61
The average number of ON-PAGE SEO SCORE for all sites is 85.48
💡 As defined by Ubersuggest, the On-Page SEO Score is a 0-100 SEO Score, with 0 being the lowest possible score. The score represents a combination of the ratio of issues found to the number of checks performed by the audit tools in Ubersuggest. It’s an overall score for all pages scanned in the audit.
Main Takeaway: What Does the Data Tell Us?
The data revealed in this portion of our study confirms that the sites we choose for our analysis are successful, powerful, popular sites that perform very well in Google Search Results.
As you can see from the data, these sites:
- rank for many keywords;
- receive a lot of backlinks;
- have high authority;
- are very effective in terms of generating organic traffic.
Site Speed Conclusions

Google considers the site’s speed a ranking factor. We saw that even the big sites are struggling with getting this perfect, though.
The average number of site speed on Desktop for all sites is 4.19 seconds.
For mobile, it’s 8.62 seconds.
You’ll want your site speed to be lower than that, both on mobile and desktop. Why?
These stats answer it best:
The average load time of the top-ranking websites in Google is under three seconds, so that is what you should strive for.
Conclusions from: Top Pages According to Traffic

We chose the top 20 pages according to the estimated monthly traffic they get for each site. Then we looked at each individual page to see how much traffic they are generating.
We also looked at:
- how many Facebook shares the pages had;
- how many Pinterest shares the pages had;
- how many words were written on those pages;
- what was their SEO optimization level;
- and how many keywords they are ranking for.
🕵️♂️How did we analyze this data?
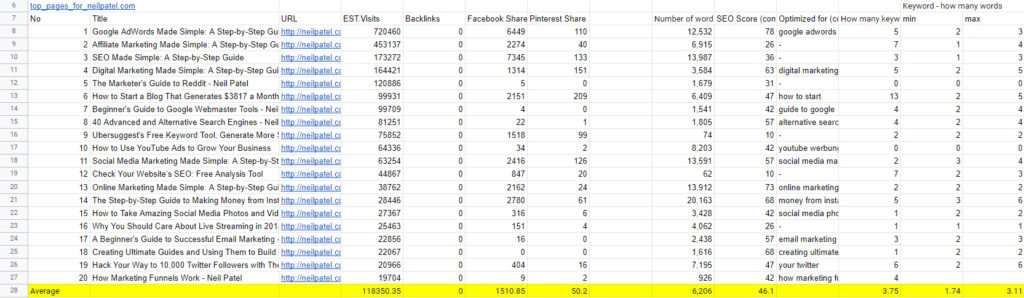
We started by creating a special sheet for each site.
Then, we took the first 20 pages according to the traffic of that site.
For each of those pages, we collected the following data:
- estimated visits;
- number of backlinks;
- the number of Facebook and Pinterest Shares;
- the number of words/article or page;
- how many keywords an article ranks for;
- and how many words each of those keywords is formed of**)
** Here’s an example of how we calculated this:
Say an article ranks for three keywords. One of those keywords is composed of one word, the other has 3 words, and the third one is composed of 4 words. In this case, the minimum number of words a keyword is composed of will be 1, and the maximum will be 4.
To be able to provide broader statistics across all 20 pages, we made an average of the number of words keywords are composed of.
Then, taking the data for the 20 pages/site, we did another average to obtain data for all sites included in this study.
We wanted to see if they are focusing on ranking just one keyword per page/article, or if they optimize for secondary keywords as well.
We were also interested to know if the keywords they rank for are long-tail keywords (which typically consist of three to five or even more words) or short-tail keywords (more general search queries consisting of one or two words).
These are the results:
The average number of Estimated Page Visits for all sites is 193,024.86
The average number of Facebook Shares for all sites is 8,039.15
The average number of Pinterest Shares for all sites is 543.12
The average Number of Words per Page for all sites is 1,481.75
The average number of keywords that rank on the 1st Page of Google/article across all sites is 4.32
The average number of minimum words used in Keywords for all sites is 1.98
The average number of maximum words used in Keywords for all sites is 3.52
Main Takeaway: What Does the Data Tell Us?
A key insight we were able to extract from this portion of the study is this:
The top pages (according to the Estimated Monthly Traffic they bring) from the successful sites included in this study each rank, on average, for four keywords on the 1st page of Google.
We also know that those keywords are long-tail keywords composed of 2 to 4 words (on average).
We also observed that the top sites included in this study don’t just focus on SEO but also on social media. Social signals (such as shares) are a confirmed ranking factor, and by working on this (like the sites in this study do), you can improve your performance in SERPs.
You can easily keep track of this aspect for the pages you want to rank by using the Focus Pages feature from Squirrly SEO.
Another thing we saw was that long-form content correlates with higher performance. The average word-count for the top 20 pages according to Estimated Monthly Traffic is 1,481.
Conclusions from: Keywords on the 1st Page of Google

When it comes to the keywords that rank on the 1st page of Google set of data, we looked at:
- the number of keywords a site ranks for;
- the number of words a ranking keyword is formed of;
- the keyword’s Search Volume (as measured by Ubersuggest; indicates the number of searches a particular keyword has during a month);
- the keyword’s Position on Google Search Results;
- the average SEO Difficulty of each keyword (as measured by Ubersuggest; indicates the estimated competition in organic search, the higher the number the more competitive);
- the estimated number of visits that the ranking keywords have generated.
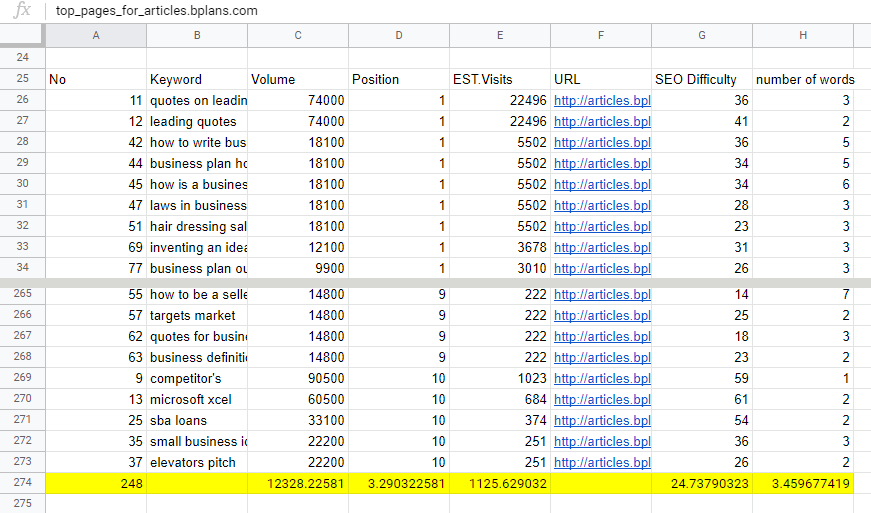
Just like the data for the top pages, we also gathered this info for each site in its own sheet (as you see in the screenshot above).
The numbers that we get for each site were then written in the main file we used for this study. There is where we made an average of all the 105 sites included in our analysis.
These are the results:
The average Number of keywords on the 1st page of Google from all sites is 209.01
The average Number of words a keyword is composed of from all sites is 3.24
The average Search Volume a keyword has from all sites is 225,111.60
💡Search Volume is the number of searches that a particular keyword has during a month.
The average Position a keyword has from all sites is 3.91
💡 The Average Position is the position a URL ranks in Google Search for a specific keyword.
The average Estimated Monthly Visits from all sites is 9,655.25
💡Estimated Monthly Visits refers to the estimated traffic web pages get from Google for the terms they rank for.
The average SEO difficulty from all sites is 23.96
💡Average SEO difficulty is the estimated competition in organic search, the higher the number the more competitive.)
Main Takeaway: What Does the Data Tell Us?
You should focus on long-tail keywords composed of 3 words or more (the data from this study suggest that 3-words is the sweet spot for keywords that rank on the 1st Page of Google).
You should be happy and celebrate your success if your average position of all the keywords that rank on the 1st Page of Google is 3.91.
The data from this study also indicates that you should target keywords that have the potential to bring about 9,655 monthly traffic combined.
That means that you can have 10 keywords that can bring 1,000 monthly visits, and you will get a Total Monthly Traffic of 10,000.
Conclusions from: SEO Issues Analyzed
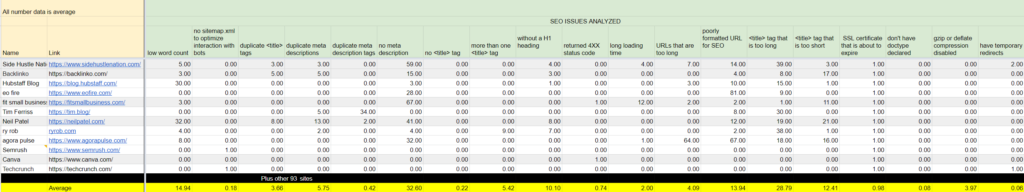
There is a more detailed article regarding this section of the study that you can check out here.
If you don’t have time to read the whole thing right now, then here’s a quick overview of the most important results that we got.
The average number for the error : low word count from all sites is 14.94
The average number for the error : no sitemap.xml to optimize interaction with bots from all sites is 0.18
The average number for the error : duplicate
Main Takeaway: What Does the Data Tell Us?
You shouldn’t be too hard on yourself, because even super-popular sites with large marketing budgets are guilty of making SEO mistakes and overlooking to correct them.
However, you should try to have as few errors as possible – as a low number of SEO issues strongly correlates with high site performance.
By using the SEO protection provided by Squirrly SEO alongside the Audit and the Focus Pages feature, you could actually do better than the sites included in this study.
That’s because you will be aware of the issues that are impacting your site’s performance on Google – and get step-by-step instructions on how to fix them.
For the next segment of our study, we’ll move on to data that we retrieved using our content analysis software: ContentLook.
Conclusions from Data Collected from ContentLook

The average SEO Score* from all sites is 59
(*SEO score is a metric calculated by our content analysis tool: ContentLook).
In ContentLook, an SEO score of over 40 indicates that the sites which received it are investing time and resources into optimizing their content for SEO.
The average number of Duplicate titles from all sites is 11
The average number of Duplicate Descriptions from all sites is 13
The average number of Empty Titles from all sites is 1
The average number of Empty Descriptions from all sites is 58
The average number of words a Title-Tag is composed of is 50
The average number of words a meta description is composed of is 115
The majority of the sites included in this study DON’T have:
- Duplicate Meta Tags;
- Duplicate Open Graph Meta Tags;
- Duplicate Twitter Card Meta Tags;
- Duplicate Meta Titles;
- Duplicate Meta Descriptions.
The majority of the sites included in this study:
- Have Canonical Links;
- Have Robots. txt files;
- Are listed as Safe Browsing sites;
- Have implemented the Open Graph Protocol;
- Have Share Buttons in their articles;
- Have social “Follow me” Buttons;
- Have Twitter Cards;
- Have NoFollow Outgoing Links;
- Have Site Icons;
- Have Apple Icons.
The average number for Outgoing doFollow links is 1
The average number for Domain Age is 13
Main Takeaway: What Does the Data Tell Us?
You should try to get a ContentLook score bigger than 40.
We saw that sites that have scores between 30 to 39 know about SEO but they don’t really focus on optimization.
The sites that have an SEO Score of over 40 are the ones that are really investing time and resources into creating SEO-optimized articles.
An SEO Score over 70 (as measured by ContentLook) indicates that the sites go above and beyond with their optimization efforts, optimizing their page content as well as other elements from their site such as the footer, headers, and their menu.
You can create a free ContentLook account here to gain valuable insights into your site’s performance and set up tasks to improve.
As this study revealed, even big sites have issues.
(Every site we analyzed had at least one SEO error. The majority of sites we looked at had over 8 issues each.)
By working on fixing these issues, they could maximize their traffic potential and further increase their success.
Our study also revealed that the average number of characters for a title tag is 50, while the average number of characters for a meta description is 115.
It’s very important to have original titles and meta descriptions. Make sure you don’t have:
- any empty titles,
- any duplicate meta tags.
This is really easy to do this with Squirrly’s Bulk SEO settings.
Here are a few other things that should be on your checklist.
Make sure that:
1. You have canonical links and a robots.txt file.
2. Your site is listed as a Safe Browsing site.
3. You have a Site Icon and Apple Icon.
4. You have Open Graph Protocol and Twitter Cards for your articles.
5. You have “Follow Me” and Share buttons for your articles.
^^ These are all best practices that the majority of the sites included in this study use as well. 4 and 5 are very important for social media and help ensure that both you and your readers can easily share your articles on social media.
And the last thing, you should be patient. (this is usually the hardest, I know).
The sites included in this study have an average domain age of 13 years.
If you’re only just starting out, try to have realistic expectations and not expect to be able to compete with a site that has been out there for 13 years right away.
The last set of data refers to the top 100 pages for each site.

Here’s what we looked at:
- the title length (in characters);
- the average number of words for the top 100 pages from each site;
- the average number of keywords that the site has optimized for a sample of 100 pages;
- the average number of keywords that a site has optimized for one article;
- the average number of words keywords are composed of;
- the average On-Page SEO score per article;
- the average number of words the meta descriptions are composed of;
- and the average number of Page Authority.
The 100 pages/articles were selected based on how many words they have.
That means we’ve selected the pages with the most words (per site). We chose this as a factor because we saw that the more you write on a single page and optimize, the more chances that page has to rank on Google.

When it comes to keywords, the first three columns in the image above show the keywords that the article has been optimized for. Some articles were optimized for a single keyword, others for two keywords, and there were also pages that were optimized for three keywords.
Then we added the number of keywords the 100 pages were optimized for and got a total of 290. (results: each page is optimized, on average, for 2.9 keywords).
We also looked at the average number of words the keywords were composed of. Following a similar methodology, we saw that keywords for which the 100 pages rank for were composed, on average, of 2.85 words.
The purpose of this was to see if the sites included in our study are targeting long-tail keywords or if they mainly focus on broad, general terms.
Here is the data we got for all the sites:
The average Title Length of the 100 pages is 62.85
The average Word Count of the 100 pages is 2,158.69
The average Number of Keywords 100 pages are optimized for is 208.24
The average Number of Keyword an article is optimized for is 2.12
The average Number of words that one Keyword is composed for the 100 pages is 2.13
The average On-Page SEO Score per article of the 100 pages is 52.44
The average number of words that the Meta Description has for the 100 pages is 19.51
The average Page Authority per article of the 100 pages is 25.56
Main Takeaway: What Does the Data Tell Us?
A site optimizes for about 208 keywords (for the top word count 100 pages). This means, that every page is optimized for about 2 keywords each.
Again, this data represents an average, meaning some of the pages could be optimized for more than 2 keywords, while other pages may be optimized for less than 2 keywords.
A typical page of the 100 we analyzed across all sites has the following characteristics:
- The title is composed of about 63 characters and the page is about 2,159 words long.
- The page is also optimized for at least 2 keywords and the keywords are long-tail keywords composed of 2 words.
- The page optimization level is about 52 %.
- The meta description is composed of about 20 words.
- The page has an authority of about 26.
The most optimized site from this study is bplans.com:
Here are some insights about it:
- Optimizes for 299 keywords (data refers to 100 pages, so a page is, on average, optimized for about 3 keywords)
- The keywords that pages are optimized for are composed of between 2 and 3 words.
- The articles are 3,804 words long (on average).
- The optimization score is 52 and the authority score is 18.27.
After retrieving all the data for all the sites, we decided to categorize the sites according to their SEO SCORE.*
(*SEO score is a metric calculated by our content analysis tool: ContentLook).
The SEO score is a good indicator of how much a certain website is focusing on SEO.
An SEO Score of over 40 indicates that the sites which received it are investing time and resources into optimizing their content for SEO.
An SEO Score over 70 is given to sites that go above and beyond with their optimization efforts, optimizing their page content as well as other elements from their site such as the footer, headers, and their menu.
Based on the SEO score that was given to each site included in this study, we ended up with 6 categories:
- 0-10 (1 site in this category)
- 30-39 (1 site in this category)
- 40-49 (11 sites in this category)
- 50-59 (48 sites in this category)
- 60-69 (30 sites in this category)
- 70-79 (13 sites in this category)
Note! Since there was only 1 site in the 0-10 SEO Score Category and 1 site in the 30-39 SEO Score Category, we disregarded those categories for the next phase of our study.
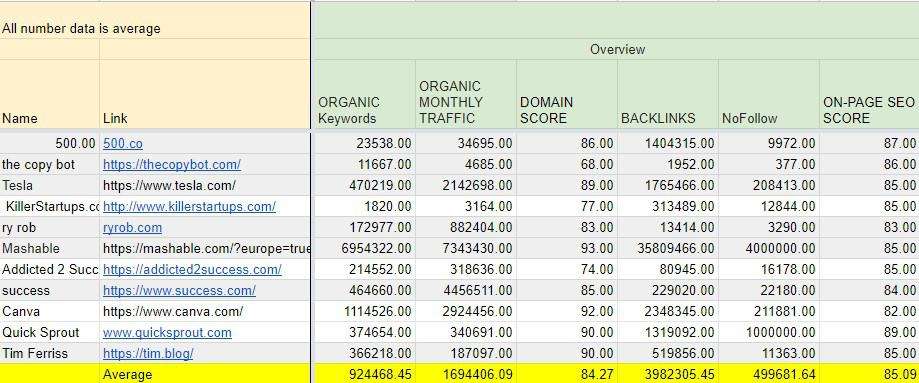
40 – 49 SEO Score Category
A total of 11 sites are included in this SEO Score category.
Below, you can see exactly which are these sites, as well as which is their SEO score.
1. https://500.co/blog/ ( SEO Score: 43)
2. https://www.tesla.com/ ( SEO Score: 47)
3. http://www.killerstartups.com/ ( SEO Score: 47)
4. https://thecopybot.com/ ( SEO Score: 47)
5. https://www.ryrob.com/ ( SEO Score: 47)
6. https://www.canva.com/ ( SEO Score: 48)
7. https://mashable.com/?europe=true ( SEO Score: 48)
8. https://addicted2success.com/ ( SEO Score: 48)
9. https://www.success.com/ ( SEO Score: 48)
10. https://www.quicksprout.com/ ( SEO Score: 49)
11. https://tim.blog/ ( SEO Score: 49)
Site Speed Conclusions

The average site speed on desktop for all sites is 1.64. For mobile, it’s 8.18.
Main Takeaway: What Does the Data Tell Us?
The sites have a good speed for desktop but still have to work on improving the speed with which they load on mobile.
If they would increase their speed, the sites could reduce the bounce rate and increase their conversion rate.
As a best practice, you should strive to make sure your pages load fast both on mobile and on desktop (under three seconds).
Conclusions from: Top 20 Pages according to Traffic

The average number of Estimated Page Visits for all sites is 106,417.66
The average number of Facebook Shares for all sites is 3,395.92
The average number of Pinterest Shares for all sites is 2,758.60
The average Number of Words per Page for all sites is 1,972.97
The average number of On–Page SEO Optimization for all sites is 42.33
The average number of keywords that rank on the 1st Page of Google/article across all sites is 5.44
The average number of minimum words used in Keywords for all sites is 1.74
The average number of maximum words used in Keywords for all sites is 3.11
Main Takeaway: What Does the Data Tell Us?
A typical page that is part of the 20 top pages (based on estimated monthly traffic) from sites in this category:
- has about 1,900 words,
- ranks on the 1st Page of Google for about 5 keywords and those keywords are composed of 2 to 3 words.
The page is also shared on social media.
Conclusions from: Keywords on the 1st Page of Google

The average Number of keywords on the first page of Google for all sites is 231.36
The average Number of words a keyword is composed of for all sites is 3.14
The average Search Volume a keyword has for all sites is 302,408.14
💡Search Volume is the number of searches a particular keyword has during a month.
The average Position a keyword has for all sites is 3.79
💡The position shows how high up a keyword ranks on Google. To be on the 1st Page of Google, you need to rank among the top 10 positions in Google.
The average Estimated Monthly Visits for all sites is 11,971.93
💡This indicates the estimated traffic a web page gets from Google for a particular search term.
The average SEO difficulty for all sites is 28.24
💡SEO difficulty = estimated competition in organic search. The higher the number, the higher the competition.
Main Takeaway: What Does the Data Tell Us?
A site in this category ranks for about 231 keywords on the 1st Page of Google.
Those keywords are long-tail keywords composed of about 3 words.
The average position those keywords rank for is 3, 4.
They bring about 11,971 monthly visits to the site.
Conclusions from: SEO Issues Analyzed

The average number for the error : low word count from all sites is 5.09
The average number for the error : no sitemap.xml to optimize interaction with bots from all sites is 0.27
The average number for the error : duplicate <title> tags from all sites is 2.27
The average number for the error : duplicate meta descriptions from all sites is 1.00
The average number for the error : duplicate meta description tags from all sites is 3.09
The average number for the error : no meta description from all sites is 19.73
The average number for the error : no <title> tag from all sites is 0.00
The average number for the error : more than one <title> tag from all sites is 8.09
The average number for the error : without a H1 heading from all sites is 7.55
The average number for the error : returned 4XX status code from all sites is 1.27
The average number for the error : long loading time from all sites is 0.09
The average number for the error : URLs that are too long from all sites is 3.18
The average number for the error : poorly formatted URL for SEO from all sites is 8.36
The average number for the error : <title> tag that is too long from all sites is 20.91
The average number for the error : <title> tag that is too short from all sites is 7.82
The average number for the error : SSL certificate that is about to expire from all sites is 1.00
The average number for the error : don’t have doctype declared from all sites is 0.00
The average number for the error : gzip or deflate compression disabled from all sites is 0.00
The average number for the error : have temporary redirects from all sites is 0.00
Main Takeaway: What Does the Data Tell Us?
The sites in this category have quite some errors they have to fix.
Squirrly SEO will help you prevent or fix the no sitemap, duplicate content, empty title or description tags, long loading time as well the poorly formatted URL for SEO errors.
Read: 70 Technical SEO Aspects Handled by Squirrly SEO >>
As you can see, just by using Squirrly SEO and fixing what the plugin is telling you to fix, you will be able to stay on top of common SEO issues that affect performance in a negative way.
Conclusions from Data Collected from ContentLook

The average SEO Score* based on data gathered from all sites in this category is 47.36
*SEO score is a metric calculated by our content analysis tool: ContentLook. In ContentLook, an SEO score of over 40 indicates that the sites which received it are investing time and resources into optimizing their content for SEO.
The average Duplicate titles errors from all sites is 16.64
The average Duplicate Descriptions error from all sites is 12.73
The average Empty Titles error from all sites is 0.73
The average Empty Descriptions error from all sites is 54.18
The average number of words a Title Tag is composed of is 35.45
The average number of words a meta description is composed of is 111.73
Most sites from this category have Duplicate Meta Tags.
Most sites from this category DON’T have:
- Duplicate Open Graph Meta Tags;
- Duplicate Twitter Card Meta Tags;
- Duplicate Meta Titles;
- Duplicate Meta Descriptions.
Most sites from this category:
- have Canonical Links;
- have Robots.txt files;
- are labeled as Safe Browsing sites;
- have implemented the Open Graph protocol;
- have Share Buttons in their articles;
- have Social “Follow Me” Buttons;
- have Twitter Cards;
- have NoFollow Outgoing Links;
- have Site Icons;
- have Apple Icons.
The average number for Outgoing doFollow links is 4.64
The average number for Domain Age is 9.45
Main Takeaway: What Does the Data Tell Us?
The average ContentLook SEO score for those sites is 47. This indicates that sites in this category are investing time and resources into optimizing their content for SEO.
Their title tag is composed, on average, of 35 characters and the meta description is composed of 112 characters. They have:
- duplicate content errors,
- as well as empty tags errors.
The sites in this category have an average domain age of 9.45 years, which is an aspect that helps them be more competitive.
Domain age indicates how long it has been since Google first indexed that domain, or saw a link to the domain, and is a factor in determining Google rankings.
Conclusions from Data Collected from ContentLook Export

This data has been generated as a result of analyzing 100 pages from each site included in this category.
Here are the main results:
The average Title Length of the 100 pages is 60.50
The average Word Count of the 100 pages is 2,998.12
The average Number of Keywords 100 pages are optimized for is 205.40
The average Number of Keyword an article is optimized for is 2.11
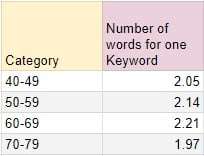
The average Number of words for one Keyword of the 100 pages is 2.05
The average On-Page SEO Score per article of the 100 pages is 52.92
The average number of words that Meta Description has of the 100 pages is 20.53
The average Page Authority per article of the 100 pages is 25.11
Main Takeaway: What Does the Data Tell Us?
A site in this category optimizes for about 205 keywords for 100 pages.
A typical page for a site in this category looks like this:
- The title is composed of about 60 characters and the page is about 2,998 words long.
- The page is also optimized for at least 2 keywords and the keywords are long-tail keywords composed of 2 words.
- The On-Page optimization level is about 53 %.
- The meta description is composed of about 21 words.
- The page has an authority of about 25.
The most optimized site in this category is ryrob.com.
Here are some insights about it:
- Optimizes for 286.00 keywords for 100 pages.
- The number of keywords an article is optimized for is almost 3 and the keywords are composed of 2 to 3 words.
- On average, the articles are 10,247 words long.
- The optimization score is 80. Ryrob.com has the BEST Optimization score in this category.
- However, it has the lowest authority score in this category (13.23)
If we sort the list from A-Z according to the number of keywords a site optimized for 100 pages we can see that it’s in a relationship with the SEO optimization score.
Only two sites are breaking the pattern but they have an authority of 30. You can compensate for your low authority by optimizing for more keywords.
*all numbers are average. That means some pages can have better or worse stats.
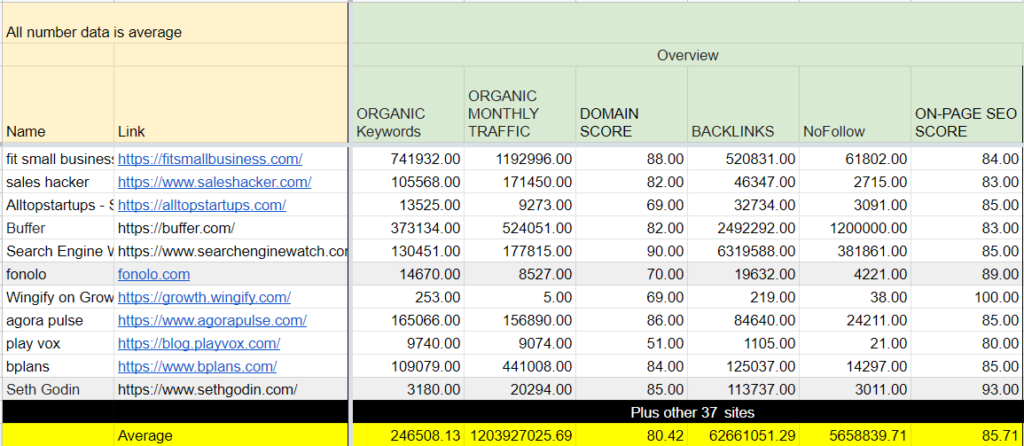
50 – 59 SEO Score Category
A total of 48 sites are included in this category:
1. https://neilpatel.com/ ( SEO Score: 50)
2. https://www.saleshacker.com/ ( SEO Score: 50)
3. https://jamesaltucher.com/ ( SEO Score: 50)
4. https://www.searchengine watch.com/ ( SEO Score: 51)
5. https://www.marketing profs.com/ ( SEO Score: 51)
6. https://growth.wingify.com/ ( SEO Score: 51)
7. https://www.agorapulse.com/ ( SEO Score: 52)
8. https://yaro.blog/ ( SEO Score: 52)
9. https://appsumo.com/ ( SEO Score: 53)
10. https://www.bplans.com/ ( SEO Score: 53)
11. https://www.eofire.com/ ( SEO Score: 53)
12. https://convertkit.com/ ( SEO Score: 53)
13. https://www.sethgodin.com/ ( SEO Score: 54)
14. https://searchengineland.com/ ( SEO Score: 54)
15. https://smallbiztrends.com/ ( SEO Score: 54)
16. https://www.garyvaynerchuk .com/ ( SEO Score: 55)
17. https://guykawasaki.com/ ( SEO Score: 55)
18. https://www.feedough.com/ ( SEO Score: 55)
19. https://www.techworld.com/ ( SEO Score: 55)
20. https://www.techuniverses .com/ ( SEO Score: 55)
21. https://naomisimson.com/ ( SEO Score: 55)
22. https://www.sidehustlenation .com/ ( SEO Score: 55)
23. https://blog.hubstaff.com/ ( SEO Score: 55)
24. https://www.digitalmarketer .com/ ( SEO Score: 55)
25. https://businesstown.com/ ( SEO Score: 56)
26. https://fitsmallbusiness.com/ ( SEO Score: 56)
27. https://sproutsocial.com/ ( SEO Score: 56)
28. https://salesgravy.com/ ( SEO Score: 56)
29. https://copyhackers.com/ ( SEO Score: 56)
30. https://menwithpens.ca/ ( SEO Score: 56)
31. https://moz.com/ ( SEO Score: 57)
32. https://alltopstartups.com/ ( SEO Score: 57)
33. https://www.salesforlife.com/ ( SEO Score: 57)
34. https://www.theselfemployed .com/ ( SEO Score: 57)
35. https://www.zendesk.com/ blog/ ( SEO Score: 57)
36. https://www.marieforleo.com/ ( SEO Score: 57)
37. https://jamesclear.com/ ( SEO Score: 57)
38. https://venturebeat.com/ ( SEO Score: 57)
39. https://buffer.com/ ( SEO Score: 58)
40. https://contentmarketing institute.com/ ( SEO Score: 58)
41. https://blog.playvox.com/ ( SEO Score: 58)
42. https://fonolo.com/ ( SEO Score: 58)
43. https://www.hubspot.com/ ( SEO Score: 59)
44. https://www.addthis.com/ ( SEO Score: 59)
45. https://socialtriggers.com/ ( SEO Score: 59)
46. https://theworkathomewife .com/ ( SEO Score: 59)
47. https://www.corpnet.com/ ( SEO Score: 59)
48. https://socialnomics.net/ ( SEO Score: 59)
Site Speed Conclusions

The average number of site speed on desktop for all sites is 5.21 seconds and for mobile is 9.15 seconds.
Main Takeaway: What Does the Data Tell Us?
The sites in this category are not doing very well in the speed department.
For desktop, they have a 5-seconds load time. For mobile, they have a 9-seconds load time. That’s more than what is generally viewed as good speed, namely three seconds or less.
Conclusions from: Top 20 Pages according to Traffic

The average number of Estimated Page Visits for all sites is 20,535.70
The average number of Facebook Shares for all sites is 3,184.77
The average number of Pinterest Shares for all sites is 153.59
The average Number of Words per Page for all sites is 1,593.21
The average number of On-Page SEO Optimization for all sites is 51.78
The average number of Keywords that rank on the 1st Page of Google/article across all sites is 4.52
The average number of minimum words used in Keywords for all sites is 1.95
The average number of maximum words used in Keywords for all sites is 3.66
Main Takeaway: What Does the Data Tell Us?
An average page of a site that is part of this category looks like this:
- It’s about 1,600 words long,
- Has a 52% optimization level;
- Ranks for about 5 keywords on the 1st Page of Google;
- The keywords are long-tail keywords composed of 2 to 4 words.
- Is shared on social media.
Conclusions from: Keywords on the 1st Page of Google

The average Number of keywords on the first page of Google for all sites is 214.56
The average Number of words a keyword is composed of for all sites is 3.41
The average Search Volume a keyword has for all sites is 25,535.54
💡Search volume is the number of searches that a particular keyword has during a month.
The average Position a keyword has for all sites is 3.72
💡 The Average Position is the position a URL ranks in Google search for a specific keyword.
The average Estimated Monthly Visits for all sites is 1,049.20
💡Estimated Monthly Visits refers to the estimated traffic a web page gets from Google for a particular term.
The average SEO difficulty for all sites is 20.93
💡Average SEO difficulty is the estimated competition in organic search, the higher the number the more competitive.)
Main Takeaway: What Does the Data Tell Us?
A site that is part of this category ranks on the 1st page of Google with about 214 keywords.
The keywords are long-tail keywords composed of about 3 words.
The average position they rank for is 4.
Conclusions from: SEO Issues Analyzed

The average number for the error : low word count from all sites is 11.04
The average number for the error : no sitemap.xml to optimize interaction with bots from all sites is 0.21
The average number for the error : duplicate <title> tags from all sites is 3.04
The average number for the error : duplicate meta descriptions from all sites is 4.04
The average number for the error : duplicate meta description tags from all sites is 0.21
The average number for the error : no meta description from all sites is 32.38
The average number for the error : no <title> tag from all sites is 0.48
The average number for the error : more than one <title> tag from all sites is 5.88
The average number for the error : without a H1 heading from all sites is 10.88
The average number for the error : returned 4XX status code from all sites is 0.15
The average number for the error : long loading time from all sites is 2.06
The average number for the error : URLs that are too long from all sites is 4.21
The average number for the error : poorly formatted URL for SEO from all sites is 15.35
The average number for the error : <title> tag that is too long from all sites is 28.10
The average number for the error : <title> tag that is too short from all sites is 11.58
The average number for the error : SSL certificate that is about to expire from all sites is 0.98
The average number for the error : don’t have doctype declared from all sites is 0.17
The average number for the error : gzip or deflate compression disabled from all sites is 2.75
The average number for the error : have temporary redirects from all sites is 0.06
Main Takeaway: What Does the Data Tell Us?
Those sites still have errors that can be easily acknowledged, tracked, and corrected with Squirrly SEO.
Conclusions from Data Collected from ContentLook

The average SEO Score* number from all sites is 55.29
(*SEO score is a metric calculated by our content analysis tool: ContentLook).
In ContentLook, an SEO score of over 40 indicates that the sites which received it are investing time and resources into optimizing their content for SEO.
The average Duplicate titles errors from all sites is 13.77
The average Duplicate Descriptions error from all sites is 14.30
The average Empty Titles error from all sites is 0.48
The average Empty Descriptions error from all sites is 52.83
The average number of words a title Tag is composed of is 49
The average number of words a meta description is composed of is 120.06
Most sites in this category DON’T have:
- Duplicate Meta Tags;
- Duplicate Open Graph Meta Tags;
- Duplicate Twitter Card Meta Tags;
- Duplicate Meta Titles;
- Duplicate Meta Descriptions;
- NoFollow Outgoing Links.
Most sites in this category:
- have Canonical Links;
- have Robots.txt. files;
- are labeled as Safe Browsing sites;
- have implemented the Open Graph protocol;
- have Share Buttons in their articles;
- have Social “Follow Me” Buttons;
- have Twitter Cards;
- have Site Icons;
- have Apple Icons.
The average number for Outgoing doFollow links is 0.46
The average number for Domain Age is 12.54
Main Takeaway: What Does the Data Tell Us?
The average ContentLook SEO score is 55. (SEO score is a metric calculated by our content analysis tool: ContentLook). In ContentLook, an SEO score of over 40 indicates that the sites which received it are investing time and resources into optimizing their content for SEO.)
The sites in this category don’t have duplicate meta tags. They have all the elements for a good social media sharing experience.
A title on these sites is composed, on average, of 49 characters and the meta description is composed of 120 characters.
The sites are loading fast and are, on average, about 13 years old.
Conclusions from Data Collected from ContentLook Export

This data has been generated as a result of analyzing 100 pages from each site included in this category.
The average Title Length of the 100 pages is 59.84
The average Word Count of the 100 pages is 2,335.38
The average Number of Keyword 100 pages are optimized for is 208.21
The average Number of Keyword an article is optimized for is 2.15
The average Number of words one Keyword is composed of for the 100 pages is 2.14
The average On-Page SEO Score per article of the 100 pages is 53.24
The average number of words that Meta Description has of the 100 pages is 19.03
The average Page Authority per article of the 100 pages is 25.05
Main Takeaway: What Does the Data Tell Us?
A site from this category is optimized for about 208 keywords for 100 pages.
A typical page from a site in this category looks something like this:
- It’s rich in content, being about 2,335 words long.
- The optimized for about 2 keywords that are formed from 2 words.
- The page is optimized to about 53% and the authority is about 25.
- The title has 60 characters and the meta description has 19 words.
The most optimized site in this category is https:// www.bplans.com/.
Here are some insights about it:
- optimizes for 299 keywords (data refers to 100 pages, so a page is, on average, optimized for about 3 keywords)
- The keywords that pages are optimized for are composed of between 2 and 3 words.
- The articles are 3,804 words long (on average).
- The optimization score is 52 and the authority score is 18.27.
*all numbers are average
60- 69 SEO Score Category
A total of 30 sites are included in this category:
1. https://magazine.startus.cc/ ( SEO Score: 60)
2. http://thestartupmag.com/ ( SEO Score: 60)
3. https://hootsuite.com/ ( SEO Score: 61)
4. https://thisweekinstartups.com/ ( SEO Score: 61)
5. https://www.nomorecoldcalling .com/ ( SEO Score: 61)
6. https://hyken.com/blog/ ( SEO Score: 61)
7. https://bothsidesofthetable .com/ ( SEO Score: 62)
8. https://www.ikea.com/ ( SEO Score: 62)
9. https://startupnation.com/ ( SEO Score: 62)
10. https://www.smartpassive income.com/ ( SEO Score: 63)
11. https://www.fastcompany .com/ ( SEO Score: 64)
12. https://www.thebalancesmb .com/ ( SEO Score: 64)
13. https://www.forbes.com/ ( SEO Score: 65)
14. https://startupbeat.com/ ( SEO Score: 65)
15. https://wistia.com/ ( SEO Score: 65)
16. https://www.searchengine journal.com/ ( SEO Score: 66)
17. https://www.postplanner.com/ ( SEO Score: 66)
18. https://chrisbrogan.com/ ( SEO Score: 66)
19. https://www.shopify.com/blog ( SEO Score: 66)
20. https://www.nytimes.com/ ( SEO Score: 66)
21. https://www.socialmedia today.com/ ( SEO Score: 67)
22. https://femaleentrepreneur association.com/ ( SEO Score:67)
23. https://backlinko.com/ ( SEO Score: 68)
24. https://www.socialmedia examiner.com/ ( SEO Score: 68)
25. https://futurestartup.com/ ( SEO Score: 68)
26. https://ducttapemarketing.com/ ( SEO Score: 68)
27. https://articles.bplans.com/ ( SEO Score: 68)
28. https://www.virgin.com/richard-branson ( SEO Score: 68)
29. https://women2.com/ ( SEO Score: 68)
30. https://www.blackenterprise .com/ ( SEO Score: 69)

Site Speed Conclusions
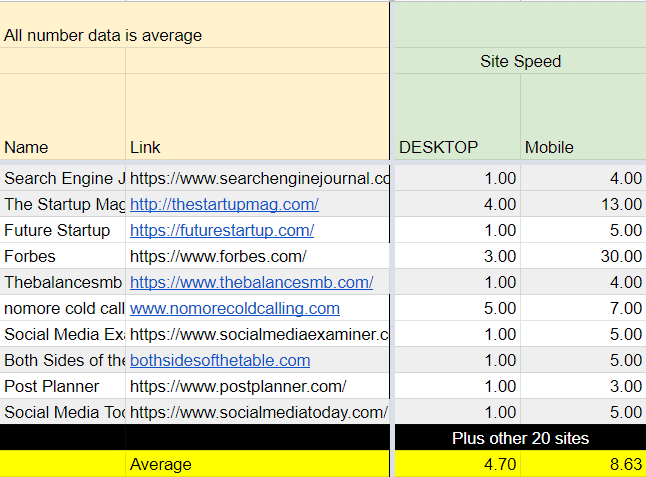
The average speed of sites in this category is 4.70 seconds (on desktop).
On mobile, it’s 8.63 seconds.
Main Takeaway: What Does the Data Tell Us?
Site speed is an aspect that could greatly be improved.
The sites in this category don’t have the best load speed as their pages load in almost 5 seconds on desktop. For mobile, that number is even higher: close to 9 seconds.
Conclusions from: Top 20 Pages According to Traffic
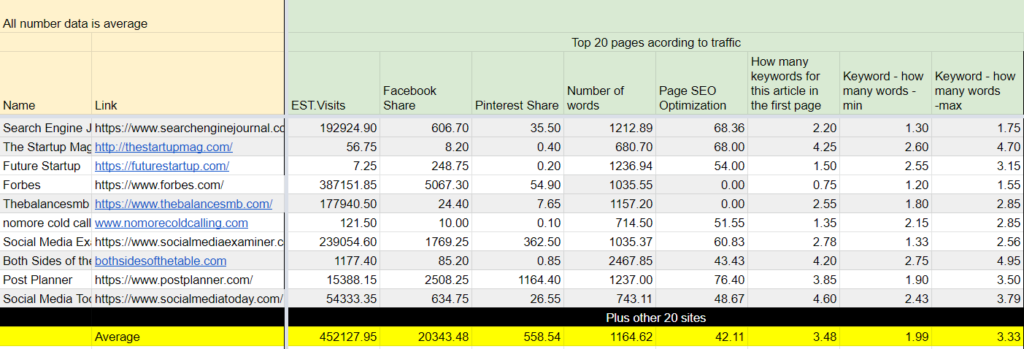
The average number of Estimated Page Visits for all sites is 452,127.95
The average number of Facebook Shares for all sites is 203,43.48
The average number of Pinterest Shares for all sites is 558.54
The average Number of Words per Page for all sites is 1,164.62
The average number of On–Page SEO Optimization for all sites is 42.11
The average number of keywords that rank on the 1st Page of Google/article across all sites is 3.48
The average number of minimum words used in Keywords for all sites is 1.99
The average number of maximum words used in Keywords for all sites is 3.33
Main Takeaway: What Does the Data Tell Us?
When it comes to the top 20 pages (based on estimated traffic), a page for a site in this category looks like this:
- It’s not extremely rich in content, being, on average, about 1,164 words long.
- The optimization level is also not so great: only 42%.
- The page ranks for about 3 keywords and the keywords are long-tail keywords composed of 2 and 3 words.
- The page is also shared on social media, mostly on Facebook.
Conclusions from: Keywords on the 1st Page of Google

The average Number of keywords on the first page of Google for all sites is 188.00
The average Number of words a keyword is composed of for all sites is 3.08
The average Search Volume a keyword has for all sites is 476,895.63
💡Search Volume is the number of searches a particular keyword has during a month.)
The average Position a keyword has for all sites is 4.14
💡The position shows how high up a keyword ranks on Google. To be on the 1st Page of Google, you need to rank among the top 10 positions in Google.
The average Estimated Monthly Visits for all sites is 21,771.02
💡This indicates the estimated traffic a web page gets from Google for a particular search term.
The average SEO difficulty for all sites is 25.99
💡SEO difficulty = estimated competition in organic search. The higher the number, the higher the competition.
Main Takeaway: What Does the Data Tell Us?
A site in this category ranks on the first page of Google for approximately 188 keywords.
They are long-tail keywords composed on average of 3 words.
The average position on which those keywords rank is 4 and the SEO difficulty is 26.
Conclusions from: SEO Issues Analyzed
The average number for the error : low word count from all sites is 21.57
The average number for the error : no sitemap.xml to optimize interaction with bots from all sites is 0.10
The average number for the error : duplicate <title> tags from all sites is 5.93
The average number for the error : duplicate meta descriptions from all sites is 8.40
The average number for the error : duplicate meta description tags from all sites is 0.00
The average number for the error : no meta description from all sites is 36.43
The average number for the error : no <title> tag from all sites is 0.00
The average number for the error : more than one <title> tag from all sites is 6.20
The average number for the error : without a H1 heading from all sites is 7.60
The average number for the error : returned 4XX status code from all sites is 1.83
The average number for the error : long loading time from all sites is 0.67
The average number for the error : URLs that are too long from all sites is 4.47
The average number for the error : poorly formatted URL for SEO from all sites is 13.83
The average number for the error : <title> tag that is too long from all sites is 37.53
The average number for the error : <title> tag that is too short from all sites is 16.67
The average number for the error : SSL certificate that is about to expire from all sites is 0.97
The average number for the error : don’t have doctype declared from all sites is 0.00
The average number for the error : gzip or deflate compression disabled from all sites is 4.80
The average number for the error : have temporary redirects from all sites is 0.03
Main Takeaway: What Does the Data Tell Us?
Those sites have some errors as well, with the most common error for sites in this category being the one related to no meta description.
Conclusions from Data Collected from ContentLook

The average Score number from all sites is 64.83
SEO score is a metric calculated by our content analysis tool: ContentLook. In ContentLook, an SEO score of over 40 indicates that the sites which received it are investing time and resources into optimizing their content for SEO.
The average Duplicate titles errors from all sites is 5.97
The average Duplicate Descriptions error from all sites is 5.37
The average Empty Titles error from all sites is 2.43
The average Empty Descriptions error from all sites is 75.37
The average number of words a title Tag is composed of is 53.60
The average number of words a meta description is composed of is 112.33
Most sites in this category DON’T have:
- Duplicate Meta Tags;
- Duplicate Open Graph Meta Tags;
- Duplicate Twitter Card Meta Tags;
- Duplicate Meta Titles;
- Duplicate Meta Descriptions.
Most sites in this category:
- have Canonical Links;
- have a Robots.txt file;
- have implemented the Open Graph protocol;
- have Share Buttons in their articles;
- have Social “Follow Me” Buttons;
- have Twitter Cards;
- have NoFollow Outgoing Links;
- have Site Icons;
- have Apple Icons.
The average number for Outgoing doFollow links is 1.17
The average number for Domain Age is 14.17
Main Takeaway: What Does the Data Tell Us?
The average ContentLook SEO score for this category is 65. That’s a really good SEO score.
The sites have the elements for a good social media sharing experience and have been around for about 14 years.
The sites in this category do have some duplicate errors and empty titles and descriptions.
All of those errors can be prevented or fixed with the help of Squirrly SEO. So, if you have a site and want to make sure such errors won’t affect your site’s performance, you can count on Squirrly SEO.
Conclusions from Data Collected from ContentLook Export

** This data has been generated as a result of analyzing 100 pages from each site included in this category.
Here are the main results:
The average Title Length of the 100 pages is 68.20
The average Word Count of the 100 pages is 1,828.20
The average Number of Keyword 100 pages are optimized for is 215.70
The average Number of Keyword an article is optimized for 2.16
The average Number of words for one Keyword of the 100 pages is 2.21
The average On-Page SEO Score per article of the 100 pages is 51.85
The average number of words that Meta Description has of the 100 pages is 19.98
The average Page Authority per article of the 100 pages is 26.52
Main Takeaway: What Does the Data Tell Us?
A typical page for a site in this category has the following characteristics:
- Is about 1,828 words long;
- Is optimized for about 2 keywords, and those keywords are composed of 2 words.
- The page is optimized at 52% and the title has 68 characters while the description has 20 words.
- The authority of the page is 26.
The most optimized site in this category is https:// www.socialmedia today.com/.
Here are some insights about it:
- The site is optimized for 298 keywords per 100 pages.
- The pages/articles are about 1,230 words long and are optimized for almost 3 keywords (2.98).
- It uses long-tail keywords of almost 3 words (2.96).
- The optimization score is 49.22%.
- The title length is 91 characters and does not have many descriptions so the average turned out to be just 3 words.
- The page authority is 11.
70 – 79 SEO Score Category
A total of 13 sites are included in this category:
1. https://www.entrepreneur.com/ ( SEO Score: 70)
2. https://www.allbusiness.com/ ( SEO Score: 70)
3. https://thesalesblog.com/ ( SEO Score: 70)
4. https://www.wpbeginner.com/ ( SEO Score: 70)
5. https://copyblogger.com/ ( SEO Score: 72)
6. https://www.heinzmarketing .com/ ( SEO Score: 72)
7. https://www.inc.com/ ( SEO Score: 74)
8. https://www.smallbizdaily.com/ ( SEO Score: 74)
9. https://www.businessknow how.com/ ( SEO Score: 74)
10. https://jimsmarketingblog.com/ ( SEO Score: 74)
11. https://www.helpscout.com/ ( SEO Score: 75)
12. https://contently.com/ ( SEO Score: 76)
13. https://www.noobpreneur.com/ ( SEO Score: 78)

Site Speed Conclusions

The average speed with which sites load on desktop is 2.15 seconds.
The average speed with which sites load on mobile is 7.92 seconds.
Main Takeaway: What Does the Data Tell Us?
The sites in this category are quite good at making sure that their pages load fast on desktop (2 seconds).
However, their performance is not very good if we’re referring to how fast these sites load on mobile devices (almost 8 seconds).
Conclusions from: Top 20 Pages according to Traffic
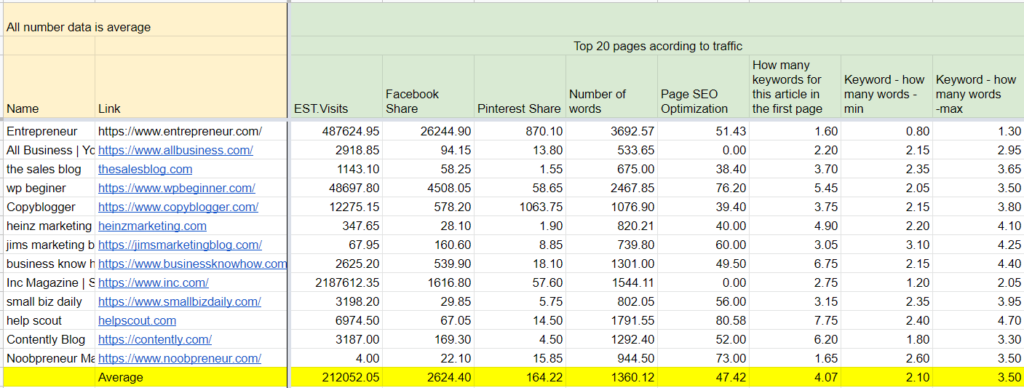
The average number of Estimated Page Visits for all sites is 212,052.05
The average number of Facebook Shares for all sites is 2,624.40
The average number of Pinterest Shares for all sites is 164.22
The average Number of Words per Page for all sites is 1,360.12
The average number of On–Page SEO Optimization for all sites is 47.42
The average number of keywords that rank on the 1st Page of Google/article across all sites is 4.07
The average number of minimum words used in Keywords for all sites is 2.10
The average number of maximum words used in Keywords for all sites is 3.50
Main Takeaway: What Does the Data Tell Us?
When it comes to the top 20 pages (based on estimated traffic they bring), a typical page looks like this:
- Is about 1,360 words long and the On-Page SEO optimization score is 47%.
- The page ranks for 4 keywords on the 1st Page of Google.
- The keywords are long-tail keywords formed of a number of words between 2 and 3 words.
- When it comes to social media networks, the page is mostly being shared on Facebook.
Conclusions from: Keywords on the 1st page of Google
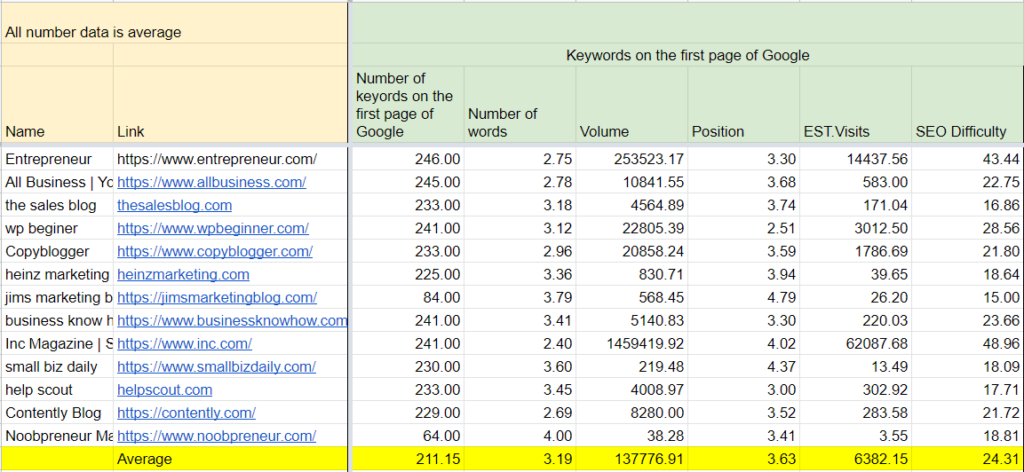
The average Number of keywords on the first page of Google for all sites is 211.15
The average Number of words a keyword is composed of for all sites is 3.19
The average Search Volume a keyword has for all sites is 137,776.91
💡Search Volume shows the number of searches that a particular keyword gets during a month.
The average Position a keyword has for all sites is 3.63
💡Positions – refers to the position on which a given URL ranks in Google search for a specific keyword.
The average Estimated Monthly Visits for all sites is 6,382.15
💡 Estimated Monthly Visits indicates the estimated traffic a web page gets from Google for a particular term.
The average SEO difficulty for all sites is 24.31
💡Average SEO difficulty is the estimated competition in organic search, the higher the number the more competitive.
Main Takeaway: What Does the Data Tell Us?
A site in this category ranks on the first page of Google for about 211 keywords.
They are long-tail keywords formed of 3 words.
The positions on which they rank on Google are 3.6 and the SEO difficulty is 24.
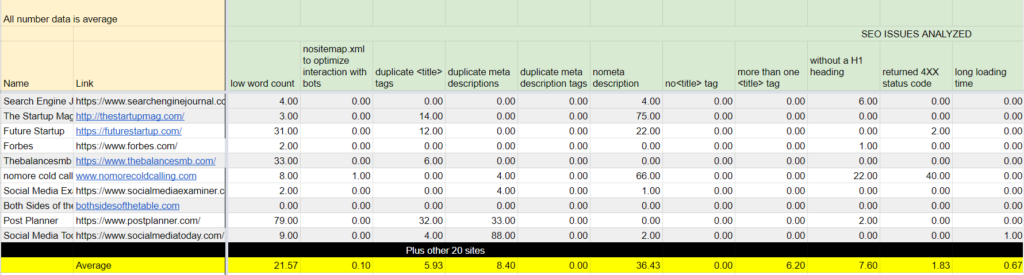
Conclusions from: SEO Issues Analyzed
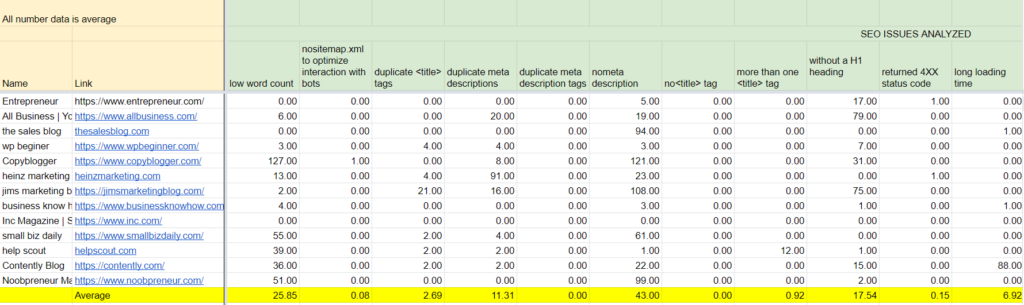
The average number for the error : low word count from all sites is 25.85
The average number for the error : no sitemap.xml to optimize interaction with bots from all sites is 0.08
The average number for the error : duplicate <title> tags from all sites is 2.69
The average number for the error : duplicate meta descriptions from all sites is 11.31
The average number for the error : duplicate meta description tags from all sites is 0.00
The average number for the error : no meta description from all sites is 43.00
The average number for the error : no <title> tag from all sites is 0.00
The average number for the error : more than one <title> tag from all sites is 0.92
The average number for the error : without a H1 heading from all sites is 17.54
The average number for the error : returned 4XX status code from all sites is 0.15
The average number for the error : long loading time from all sites is 6.92
The average number for the error : URLs that are too long from all sites is 4.46
The average number for the error : poorly formatted URL for SEO from all sites is 16.92
The average number for the error : <title> tag that is too long from all sites is 24.46
The average number for the error : <title> tag that is too short from all sites is 12.38
The average number for the error : SSL certificate that is about to expire from all sites is 1.00
The average number for the error : don’t have doctype declared from all sites is 0.00
The average number for the error : gzip or deflate compression disabled from all sites is 10.85
The average number for the error : have temporary redirects from all sites is 0.08
Main Takeaway: What Does the Data Tell Us?
The sites in this category still have some SEO errors.
If you are a Squirrly SEO user, you won’t have to worry about your site having errors as well, as you can easily prevent or fix most of those SEO issues.
Conclusions from Data Collected from ContentLook
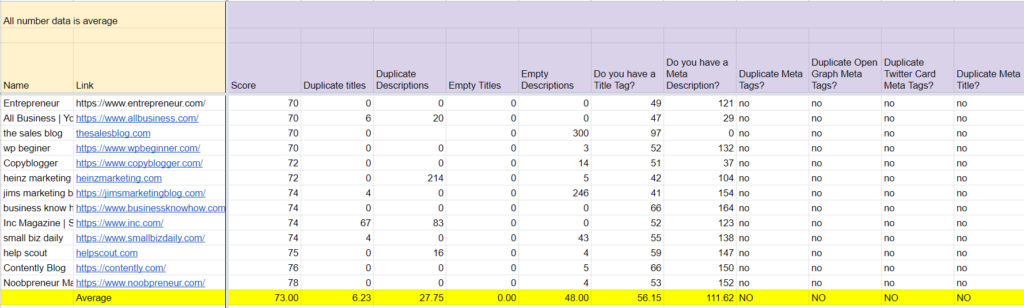
The average SEO Score* from all sites is 73
*SEO score is a metric calculated by our content analysis tool: ContentLook.
An SEO Score over 70 is given to sites that go above and beyond with their optimization efforts, optimizing their page content as well as other elements from their site such as the footer, headers, and their menu.
The average Duplicate titles errors from all sites is 6.23
The average Duplicate Descriptions error from all sites is 27.75
The average Empty Titles error from all sites is 0
The average Empty Descriptions error from all sites is 48
The average number a title Tag is composed of is 56.15
The average number a meta description is composed of is 111.62
Most of the sites DON’T have
- Duplicate Meta Tags;
- Duplicate Open Graph Meta Tags;
- Duplicate Twitter Card Meta Tags;
- Duplicate Meta Titles;
- Duplicate Meta Descriptions.
Most of the sites included in this study:
- Have canonical links;
- Have Robots. txt files;
- Are listed as Safe Browsing sites;
- Have Open Graph protocol;
- Have NoFollow Outgoing Links;
- Have Share Buttons in their articles;
- Have Social “Follow Me” Buttons;
- Have Twitter Cards;
- Have Site Icons;
- Have Apple Icons.
The average number for Outgoing doFollow links is 0.08
The average number for Domain Age is 16.08
Main Takeaway: What Does the Data Tell Us?
The average ContentLook SEO score for this category is 73.
An SEO Score over 70 is given to sites that go above and beyond with their optimization efforts, optimizing their page content as well as other elements from their site such as the footer, headers, and their menu.
However, the sites in this category still have some issues with duplicate content and empty titles. Fixing those issues could help them be even more successful.
The sites have all the social media elements necessary for a good sharing experience. The title tag is composed of is 56 and the meta description is composed of 112 characters.
Taking into account their average domain age (16 years) we can say that the sites in this category have had a lot of time to build their Authority,
Conclusions from Data Collected from ContenLook Export
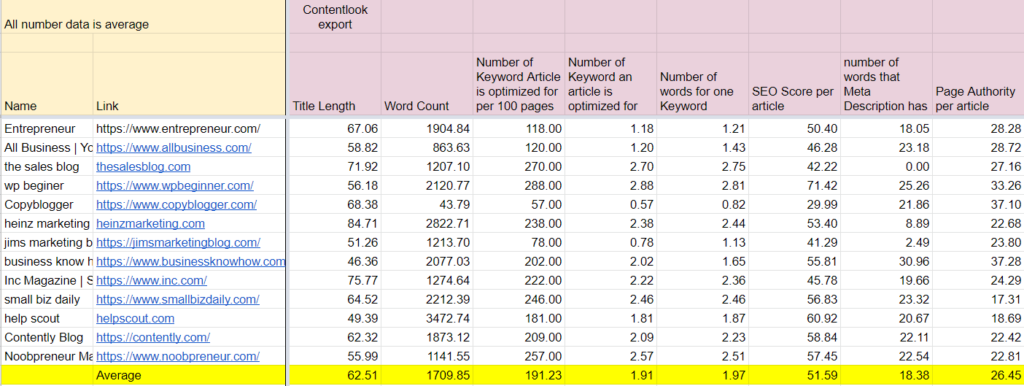
** This data has been generated as a result of analyzing 100 pages from each site included in this category.
Here are the main results:
The average Title Length of the 100 pages is 62.51
The average Word Count of the 100 pages is 1,709.85
The average Number of Keyword 100 pages are optimized for is 191.23
The average Number of Keyword an article is optimized for is 1.91
The average Number of words for one Keyword of the 100 pages is 1.97
The average On-Page SEO Score per article of the 100 pages is 51.59
The average number of words that Meta Description has of the 100 pages is 18.38
The average Page Authority per article of the 100 pages is 26.45
Main Takeaway: What Does the Data Tell Us?
A site in this category optimized for about 191 keywords for 100 pages.
Here’s what a typical page/article from a site in this category looks like:
- Is composed of 1,709 words;
- It’s optimized for approximately 2 keywords;
- The keywords are formed of 1.97 words and the article optimization is 51%;
- The title is formed of 62 characters and the meta description is composed of 18 words;
- The page authority is 26.
The most optimized site in this category is https:// www.wpbeginner .com/.
Here are some insights about it:
- The site is optimized for 288 keywords per 100 pages.
- The pages/articles are long-form articles with an average of 2,120 words and are optimized for almost 3 keywords (2.88)
- The pages/articles have a 71% optimization level.
- It uses long-form keywords composed of almost 3 words (2.81).
- The title is formed of 56 characters and the meta description has 25 words.
- The average page authority is 33.
Comparisons
For the final segment of this analysis, we’ve compared the average numbers that every category has to see what makes them different.
Here’s what we found:

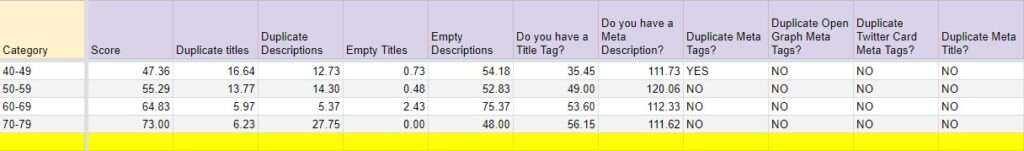
1. As you can see in the image above, the sites that have an SEO Score bigger than 60 have the least amount of duplicate titles.
👍 The title can make a user want to click on your listing or not, and having unique titles can increase your chances of getting more traffic to your site.
2. When it comes to empty titles and descriptions, we can see that the sites that have an SEO score over 40 are trying their best to ensure they don’t have any empty titles.
However, not the same can be said when referring to descriptions.
👍 With Bulk SEO Settings from Squirrly SEO, you can easily make sure that you have both these things covered. You won’t have to worry about having articles and pages on your site that don’t have titles and descriptions.

3. The sites that have an SEO Score over 50 have longer titles compared to sites in other categories included in this study.
One possible explanation could be that they are focusing on long-tail keywords. The descriptions are pretty similar, length-wise.

4. Sites that have an SEO score over 50 make sure they DO NOT have any duplicate tags.
👍This is an aspect you’ll want to get right as well, as Google penalizes sites that have Duplicate Content.
5. All sites have canonical links, as well as a robots.txt file.

6. All sites are listed as Safe Browsing sites.

7. All sites have social media elements.
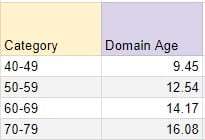
8. As you can see from the image above, the older a site is, the higher its SEO Score.
This is most likely because of all the hard work they did over the years. Also, they had time to build their authority and acquire backlinks.
9. All sites have both site and Apple icons.
Now let’s take a look at the data for 100 articles.


- All the titles are between 60 to 70 characters.

- In the image above, we can see a direct correlation between how long the articles are and the SEO score. As we previously discovered, the sites that have an SEO score of over 60 are older than the sites that have an SEO score lower than 60.
👍This indicates that it is possible to compete with sites that have been around online for longer than you have and have a higher authority than you by creating long-form, optimized content.

- By looking at the graphic above, you can see that older sites don’t tend to focus on optimizing for as many keywords as some of the other sites included in this study.
👍One possible explanation might be that these sites know that when you are a site that has a lot of clout with search engines, you have a better chance of being ranked for more keywords – even if you didn’t optimize for them using ALL available optimization techniques.

- Once again, the relationship between the Domain Age of a site and the optimization can be observed here. Almost all sites are optimizing for more than 2 keywords per article.
The keywords are long-form keywords, with more than 2 words.

- The data shown above refers to how many words sites are using in their meta description. You can see that there are no big differences between categories.

And the last piece of data is related to Page Authority. As you can observe in the image below, there are no notable differences between categories in this regard.